What “average internet speed” means in 2025
When people ask “what is the average internet speed,” they usually mean the average measured download rate (in megabits per second, Mbps) that real users experience on either fixed broadband (home wired/fiber/cable) or mobile networks (4G/5G). Important: different organizations measure this differently. Some use voluntary user tests run through speed-test apps (which tend to capture peak consumer experience), others sample ISP networks or measure median rather than mean speeds, and some report separate metrics for upload speed, latency, and peak vs. typical performance. Those methodological choices create the spread in headline numbers you see for 2025.
Headline numbers for 2025 — the range
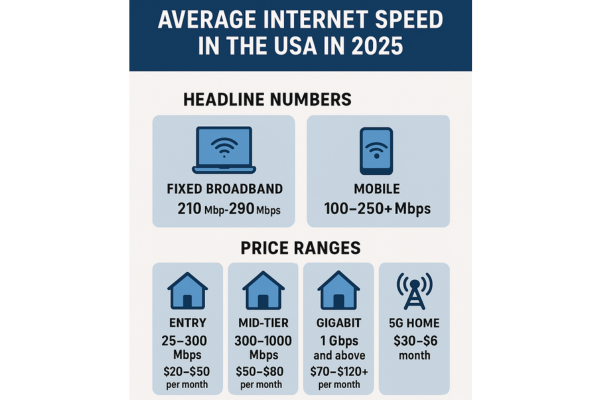
In 2025 the United States’ fixed broadband average reported by industry trackers falls roughly into a range between about 210 Mbps and nearly 290 Mbps download, depending on the data source and measurement method. Several widely cited broadband trackers that aggregate millions of user tests and ISP data reported average fixed-broadband download speeds in the low-to-mid hundreds of Mbps in 2025; some tools that emphasize median user tests report figures around ~210–215 Mbps, while larger global indexes that emphasize recent peak tests reported values approaching the high-200s by mid-2025.
For mobile (cellular) internet, 2025 shows substantially different numbers: 5G rollouts and densification pushed average mobile download speeds into the triple digits (100–250+ Mbps) range for many users, with top operators routinely reporting 5G download experiences exceeding 150–200 Mbps on average for their customers in large urban areas. OpenSignal and similar mobile-experience reports in 2025 placed leading carriers’ 5G download experiences in roughly the 150–250 Mbps band for active users.
Why numbers differ so much (short explanation)
-
Median vs. mean: Median is less skewed by a few very fast or slow tests; mean can be pulled up by high-speed fiber customers.
-
User base sampled: Some services analyze millions of voluntary consumer tests (Speedtest, HighSpeedInternet), others run ISP-provided telemetry.
-
Geography and coverage: Urban centers with fiber and dense 5G will raise a national average if weighted differently; rural areas with DSL/satellite lower it.
-
Time of day and congestion: Reports that capture peak-time performance will show lower averages than those measuring peak potential.
Because of these differences it’s more accurate to treat the U.S. 2025 “average” as a band and to compare by the metric that matters for your use (median experience vs. best-possible).
Regional variation: not all Americans get the “average”
Even though national averages jumped in 2025, speed still varies widely from state to state and city to city. States with dense fiber deployment and competitive cable markets — and many suburbs — routinely show averages well above the national mean; more remote rural ZIP codes frequently fall far below it because of DSL, older fixed wireless, or satellite dependence. State-level lists and maps for 2025 show top states with average fixed broadband well north of 200 Mbps, while slower states and rural counties may average under 50–80 Mbps. If you need reliable performance for multiple users, check county-level or provider-level numbers rather than the national headline.
Upload speeds and latency — the other half of performance
Download headline numbers get most attention, but upload speeds and latency are crucial for video calls, cloud backups, remote work, and gaming. In 2025 average upload speeds on fixed networks trailed download speeds (common on cable networks), though symmetrical fiber plans (where available) offered very high upload rates. Latency — measured in milliseconds — improved in urban fiber and 5G areas, enabling smoother real-time applications. Many consumer decisions now balance download MHz with upload symmetry and latency rather than chasing top download alone.
What consumers actually pay in 2025 (monthly price ranges)
Pricing in 2025 depends on connection type (fiber, cable, DSL, fixed wireless, satellite, or 5G home) and commitment/discounts. Below are typical market ranges observed across multiple market trackers and consumer guides:
-
Entry/budget plans (25–300 Mbps): $20–$50 per month. These plans suit light households (browsing, single-device streaming). Many ISPs offer promotional pricing near the low end for the first 12 months.
-
Mid-tier plans (300–1000 Mbps): $50–$80 per month. This tier covers multi-device 4K streaming, larger households, and moderate gaming. Fiber and DOCSIS 3.1/4.0 cable plans dominate here.
-
Gigabit and premium plans (1 Gbps and above): $70–$120+ per month. True gigabit fiber plans are often in this band; business-grade or multi-gig options cost more. Prices vary with upload symmetry, included router, and service guarantees.
-
Fixed wireless
-
/ 5G home internet: $30–$65 typical for consumer prepaid/retail offers, with new prepaid and “home 5G” products appearing at aggressive price points (some as low as $30–$40 when bundled or prepaid). Speeds vary by carrier and location; some 5G home services advertise consistent 100–400 Mbps experiences in well-served areas.
-
Satellite (rural, LEO constellations included): $50–$200+ depending on plan, speed, and data allowances; satellite remains one of the more expensive per-Mbps options for many rural customers.
Remember: promotional pricing, equipment rental fees, taxes, and one-time installation charges can add $5–$20+ to first-year bills in many markets. Also, some national averages are pulled down by legacy DSL and higher-cost satellite customers who pay more but receive slower speeds.
Value: cost per Mbps (useful way to compare)
A helpful metric is cost per Mbps. Fiber and modern cable tend to provide the best value: in 2025 typical cost-per-Mbps for fiber and high-tier cable plans is often a few cents per Mbps for higher-speed plans, while DSL and satellite can be several times more expensive per Mbps. Fixed wireless and 5G home services have improved value as 5G competitors price aggressively, particularly when they include free gateway equipment and no data caps for mid-tier plans.
Practical guidance for consumers in 2025
-
Match speed to real needs: For one-person light use, 50–100 Mbps is usually fine; for 4–6 people streaming/gaming, aim for 300–1000 Mbps.
-
Check upload and latency: If you work from home, stream, or upload large files, prioritise symmetrical fiber or higher upload tiers.
-
Watch for promotional vs. long-term price: Introductory rates can double after the promotion ends — check the regular price and contract terms.
-
Consider 5G home as a viable option: In many urban/suburban markets 5G home now competes with cable/fiber for both speed and price, though coverage can be spotty in some neighborhoods.
The outlook: what to expect after 2025
Investment in fiber builds and 5G densification continued through 2025, so average national fixed and mobile speeds are likely to keep rising in the near term — but gains will be uneven. Urban and suburban areas typically see the earliest benefits, while rural upgrades depend on federal/state funding and local operator economics. Price trends may be mixed: increased competition (5G and new ISPs) tends to put downward pressure on prices, while inflation and rising operational costs sometimes push headline rates up. The bottom line: you’ll likely see faster average speeds in 2026, but your local situation determines whether you benefit.
Takeaway bullets
-
Fixed broadband average (2025): roughly 210–290 Mbps download depending on data source and methodology.
-
Mobile/5G average (2025): commonly in the 100–250+ Mbps range for experienced users on leading networks.
-
Typical monthly prices (2025): $20–$50 (entry), $50–$80 (mid), $70–$120+ (gigabit/premium); 5G home and prepaid offerings can appear as low as $30–$40 in promotions.