World Population in 2024 by Gender
In 2024, the world continued to grow in population, but the way that growth is distributed between males and females reveals important social, economic, and health trends. Understanding the global gender distribution is not just about counting heads — it helps governments plan education, healthcare, workforce dynamics, and economic policy.
According to the latest statistical estimates, the global population in 2024 was approximately 8.16 billion people. This number reflects continued growth from previous years, shaped by birth rates, mortality, and migration patterns worldwide.
One key characteristic of the planet’s demographics is that males slightly outnumber females on a global scale, although this difference is subtle and varies widely across countries and age groups. This article explains this balance in detail to give you a clear picture of the gender proportions in the world as of 2024.
World Population 2024 — Total Numbers
To understand the gender breakdown, we first need to look at the total global population in 2024:
-
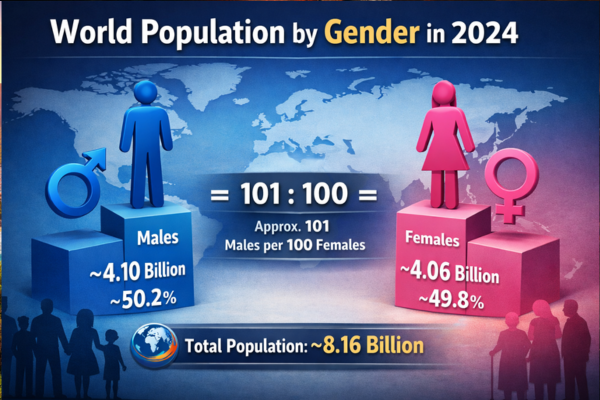
Total population: ~8.16 billion people
-
Male population: ~4.10 billion
-
Female population: ~4.06 billion
These figures suggest that males make up a slight majority of people on Earth, but the difference is relatively small in the big picture.
Breaking It Down
For clarity:
-
Males: ~4,103.6 million
-
Females: ~4,058.4 million
-
Male-to-female ratio: ~101 males per 100 females
This means that for every 100 females on the planet, there are approximately 101 males — a tiny difference, but one that statisticians monitor very closely because it influences future population trends.
Why Do These Differences Happen?
On the surface, you might expect an equal number of men and women in the world — after all, human reproduction involves both a male and a female parent. However, several biological, social, and cultural factors influence gender ratios, such as:
1. Natural Birth Ratios
At birth, there are slightly more male babies than female babies. Biologists estimate that for every 100 girls born, there are about 105 boys born worldwide. This pattern is natural and consistent across many populations.
2. Mortality Differences
Although more boys are born, males generally have higher mortality rates at many ages due to biological vulnerabilities, accidents, and risk behaviors. Females tend to live longer on average — a trend seen in many countries. This tends to make populations more female-balanced in older age groups.
3. Migration
Migration can affect gender distribution in specific regions. For example, countries with large numbers of male workers moving from rural to urban areas (or between countries for work) can temporarily increase the proportion of males.
Global Gender Distribution: A Closer Look
Percentage Breakdown (2024)
| Gender | Population | Approximate Percentage |
|---|---|---|
| Males | ~4.10 billion | ~50.2 % |
| Females | ~4.06 billion | ~49.8 % |
Even though the numbers are nearly equal, males hold a slight edge in overall global population because large countries (like India and China) have more males than females in their populations. These two countries alone influence global totals heavily.
What Does a Ratio of ~101 Males per 100 Females Mean?
A ratio above 100 means more males than females overall. A ratio below 100 would mean more females than males. In 2024, the ratio being around 101:100 tells us:
-
The imbalance is small
-
It is influenced by birth sex ratios favoring males
-
It is shaped by country-level demographic policies, health outcomes, and age distribution trends
Gender Ratio at Birth vs. Older Ages
The story doesn’t stop at raw numbers. Across different age groups, gender ratios shift:
At Birth
Globally, boys are born slightly more often than girls — on average about 105 male births per 100 female births. This is consistent with biological patterns observed around the world.
Ages 15–64
In early adult age groups, males often still slightly outnumber females due to birth patterns. However, lifestyle, occupation risk factors, wars, and accidents can begin to change this ratio over time.
Older Ages
Among older adults, women generally live longer — so the ratio gradually favors females. In populations aged 60 and above, females usually outnumber males. This pattern develops as a result of influences including:
-
Biological advantages for female longevity
-
Lower exposure to high-risk behaviors
-
Differences in health care access
Although we don’t break these exact numbers down for 2024 in this article, global demographic research consistently shows this pattern.
Why Gender Distribution Matters
Understanding the gender balance is vital for several reasons:
1. Health Planning
An aging population with more females may need more investment in long-term care services, since older women tend to live longer.
2. Education and Workforce
Countries with large male youth populations might need to focus more on creating jobs and training programs tailored for young men, while still ensuring equal opportunities for women.
3. Social Services
Government social programs often use gender population data to plan services such as childcare, eldercare, employment support, and healthcare systems.
4. Economic Trends
A balanced gender distribution supports stable labor markets. For example:
-
Too many males could create pressure on job markets and economies
-
Too many females, especially in regions with traditional labor roles, may influence social structures and economic priorities
In both cases, policies must be fine-tuned to the demographic realities of each country.
Regional Variations
The global gender balance is just a broad snapshot. Within that picture, there are big regional differences:
Gulf States
Some countries, especially in the Middle East (like Qatar and the United Arab Emirates), have very high percentages of male residents — largely due to labor migration.
Russia and Eastern Europe
Many Eastern European countries have more females than males, particularly in older age groups, because of higher male mortality — often tied to health and lifestyle patterns.
Hong Kong
Some regions like Hong Kong have more females than males in total population, partially due to longer female life expectancy.
These regional patterns show that the global figures are not uniform — local culture, economy, and health play big roles in gender distribution.
Long-Term Trends and Projections
While 2024’s global gender ratio is slightly in favor of males, long-term projections suggest that this difference may narrow over time. Some demographic experts estimate:
-
By the mid-21st century, the global male-to-female ratio could approach closer to parity (1:1)
-
Female longevity increases may eventually push overall female numbers higher in some areas
-
Declining birth rates in many countries will also affect future gender ratios
This means that the subtle male majority observed in 2024 may evolve into a nearly balanced global gender distribution by 2050 — though the timing will vary by region and country group.
What the Numbers Tell Us — In Summary
| Feature | 2024 Global Trend |
|---|---|
| Total Population | ~8.16 billion |
| Males | ~4.10 billion (~50.2 %) |
| Females | ~4.06 billion (~49.8 %) |
| Gender Ratio | ~101 males per 100 females |
| Age Patterns | More males at birth, more females in older ages |
| Regional Differences | Wide variation by country and migration patterns |
Overall, the world remains nearly balanced in gender. There is a slight tilt toward more males due to natural birth ratios and the large populations of countries like India and China. However, female longevity and regional differences make this picture complex and dynamic.
Global gender distribution is a key demographic indicator that affects every level of society — from family structures to national economic policy. The small difference between male and female populations in 2024 may not seem dramatic, but when multiplied across billions of people, it shapes patterns of employment, healthcare, social planning, and cultural change.
Understanding these numbers helps policymakers, educators, and researchers design programs that are inclusive, equitable, and sustainable for future generations.
If you’re interested in how gender ratios affect specific regions or want a deeper dive into age-specific data, demographic reports like the United Nations World Population Prospects offer rich, detailed analyses that break down the numbers further.