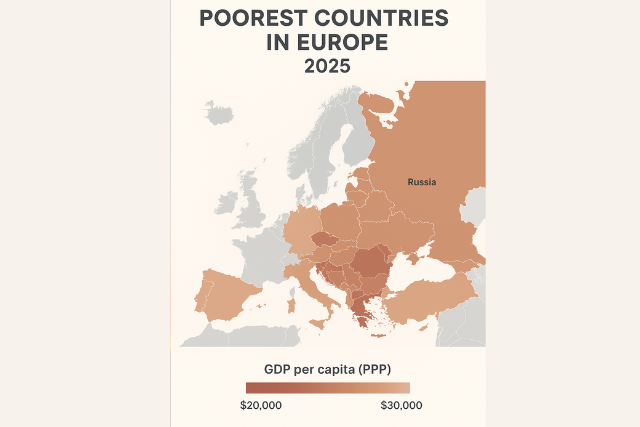
Top 20 poorest countries in Europe in 2025 —
Which European countries are the poorest in 2025? This data-driven guide ranks the 20 poorest European countries by GDP per capita (PPP) using IMF/World Economic Outlook estimates for 2025, explains why they rank low, and offers practical context for businesses, researchers, and travellers.
Introduction
When people ask “which are the poorest countries in Europe in 2025?” they usually mean measured by GDP per capita — a standard economic metric that approximates average income per person. The International Monetary Fund (IMF) publishes annual country-by-country estimates (World Economic Outlook), and those IMF-based estimates are widely used for cross-country comparisons. This article uses the IMF’s 2025 GDP-per-capita (purchasing-power-parity, PPP) estimates as the primary basis to rank European countries from lowest to higher GDP per capita.
Below you’ll find the ranked list of the 20 European countries with the lowest GDP per capita (PPP) in 2025, short explanations for each entry, and analysis of the structural reasons behind lower income levels. This page is optimized for search terms such as “poorest countries in Europe 2025,” “lowest GDP per capita Europe 2025,” and “European countries by income 2025.”
Methodology (brief)
-
Indicator used: GDP per capita adjusted for purchasing power parity (PPP), in international dollars — this controls for local price level differences and is commonly used for living-standard comparisons.
-
Source: IMF World Economic Outlook (2025 estimates) as compiled and presented in a country table (IMF data mirrored on Wikipedia’s 2025 ranking). Where helpful, World Bank PPP indicators explain the measure.
The list — Top 20 poorest countries in Europe (2025, by GDP per capita PPP)
Values are IMF 2025 estimates (international dollars). Source: IMF WEO table compiled in the public dataset.
1. Moldova — $19,678
Moldova has the lowest GDP per capita in Europe in 2025. Long-term challenges include a small domestic market, limited industrial diversification, and large migration flows that shape the labour market and domestic demand.
2. Kosovo — $20,383
Kosovo’s economy remains small and services-heavy. Post-conflict reconstruction, low levels of capital formation, and reliance on remittances affect living standards.
3. Ukraine — $20,999
Even with large human and industrial potential, Ukraine’s GDP per capita is depressed by the severe economic and infrastructural damage from prolonged conflict and the costs of reconstruction and displacement.
4. Bosnia and Herzegovina — $22,831
Bosnia’s complex political structure, stagnant investment, and industrial decline since the 1990s contribute to a lower GDP per capita. Economic reform and EU accession progress remain key for catch-up growth.
5. Albania — $23,405
Albania has improved in recent years but still ranks among the lower-income European states due to a narrow industrial base and the need for higher-value exports and investment.
6. Armenia — $25,060
Armenia’s geography, trade constraints, and periodic security shocks limit faster income convergence. The IT services and diaspora investments are growth drivers but have not yet closed the gap.
7. Azerbaijan — $26,235
Though richer in natural resources than many peers, Azerbaijan’s reliance on energy exports produces volatile income per capita and a need to diversify the economy for stable, broad-based growth.
8.North Macedonia — $29,475
North Macedonia faces the familiar middle-income traps of small markets and the need to attract sustained foreign direct investment to lift productivity and wages.
9. Georgia — $30,749
Georgia has pursued reforms to attract investment and tourism, but per capita income remains modest because of a small population, regional challenges, and limited industrial scale.
10. Serbia — $33,115
Serbia’s economy is diversified compared to the lowest-income peers, but structural reforms, employment patterns, and demographic pressure blunt rapid per-capita growth.
11. Montenegro — $33,620
Montenegro’s tourism-led economy generates seasonal income and development, yet its small size and external vulnerabilities keep average GDP per capita relatively low.
12. Belarus — $34,313
Belarus historically had higher per-person output but faces economic isolation, sanctions, and uneven private investment, which weigh on per-capita measures.
13. Bulgaria — $41,901
The lowest of the EU member states in per-capita PPP terms, Bulgaria struggles with demographic decline, regional inequality, and the need for higher productivity. EU funds help, but gaps remain.
14 Turkey — $42,451
As a transcontinental economy, Turkey’s per-capita PPP figure is higher than many neighbors but lower than most Western European countries — macro volatility and inflation episodes have reduced real incomes in recent years.
15. Latvia — $44,563
Latvia has made progress since joining the EU, yet per-capita PPP is held back by a small domestic market and migration-driven labour shortages.
16. Greece — $45,048
Greece’s per-capita PPP reflects lingering effects of the 2010s debt crisis, austerity, and low potential growth, though tourism and shipping remain strong sectors.
17. Slovakia — $47,425
Slovakia’s integration into European manufacturing supply chains helps growth, but average PPP per person still trails wealthier EU economies.
18. Hungary — $48,600
Hungary’s GDP per capita (PPP) is above many transition economies but below Western European averages, reflecting productivity and institutional gaps.
19. Romania — $49,213
Romania’s fast growth in recent years has raised incomes, but per-capita PPP remains below Western European peers due to regional development divides and emigration.
20. Russia — $49,383
Russia’s GDP per capita (PPP) places it near the lower end of the European spectrum among larger countries, influenced by sanctions, commodity dependence, and demographic trends. (Listed here because the IMF whole-country value is used; Russia is transcontinental and sometimes treated separately.)
What explains low GDP per capita in these European countries?
Several recurring factors explain why a country ends up near the bottom of a regional income ranking:
-
Small domestic markets. Small population size limits economies of scale and the domestic consumer base for high-value industries (typical for Moldova, Montenegro, Kosovo).
-
Conflict and geopolitical shocks. Countries experiencing conflict or prolonged political instability (e.g., Ukraine, parts of the Caucasus) see output and living standards fall sharply.
-
Low diversification / commodity reliance. Heavy dependence on one sector (oil/gas, agriculture) creates volatility and limits broad-based job creation (Azerbaijan is a case).
-
Demographic pressures and migration. Emigration of skilled workers lowers labour supply and tax bases, reducing per-capita output growth (seen in the Balkans and Moldova).
-
Institutional and reform gaps. Weak rule of law, corruption, or slow market reforms discourage investment and prevent productivity gains.
These patterns are visible across the list of lower-income European countries and explain the persistence of income gaps.
How reliable is this ranking?
The ranking uses IMF WEO 2025 estimates and compares GDP per capita in PPP terms, which is the standard international approach for living-standard comparisons. PPP adjusts for price-level differences and is better than nominal GDP per capita when comparing everyday purchasing power. Still, no single indicator tells the whole story — GDP per capita misses distributional issues (inequality) and non-market wellbeing (health, education). For policymaking and business decisions, supplement GDP per capita with indicators such as unemployment, median income, and human-development metrics.
Quick takeaways for readers
-
Eastern Europe and the Western Balkans dominate the bottom of the list. This reflects the long transition from centrally planned economies, emigration, and smaller domestic markets.
-
Conflict can dramatically lower per-capita output. Ukraine’s position in 2025 illustrates the economic cost of war.
-
Policy, investment, and EU integration matter. Several countries on this list (e.g., Romania, Bulgaria, the Western Balkans) have clear convergence potential if productivity-raising reforms and investment continue.
FAQ (short)
Q: Is GDP per capita the only way to define “poorest”?
A: No. You can also use median income, poverty rates, Human Development Index, or consumption per person. GDP per capita is the most common, widely available comparator.
Q: Why do some larger countries (e.g., Russia, Turkey) appear among the lower half?
A: Large countries can have moderate average incomes if growth is uneven, if resource dependence causes volatility, or if PPP adjustments and domestic price levels reduce measured per-capita PPP. Context matters.
Q: Where can I find the raw IMF numbers?
A: The IMF World Economic Outlook database provides downloadable tables and the underlying country estimates for 2025. The Wikipedia table used here cites IMF WEO.
Hello There. I found your blog using msn.This is
a really well written article. I will make sure to bookmark it and return to read more off your useful information. Thanks for the post.
I will definitely comeback.