The poorest countries in the world in 2025
Which country is the poorest in the world in 2025? Discover the top poorest countries in 2025 by GDP per capita (PPP), why they rank low, how different measures change the order, and what this means for development and aid policy.
Answer
By the widely used measure GDP per capita (purchasing-power parity, PPP), South Sudan is commonly reported as the poorest country in the world in 2025. Several data compilers (IMF/World Bank–based lists, VisualCapitalist, Global Finance, etc.) place South Sudan at the bottom of 2025 rankings, followed by countries such as Burundi, the Central African Republic, Yemen, Mozambique and Malawi.
Why GDP per capita (PPP) — and why rankings differ
When people ask “which is the poorest country?” they usually mean “which country has the lowest income per person.” That can be measured several ways:
-
GDP per capita (PPP) — adjusts for cost-of-living differences; better for comparing living standards across countries. Widely used by IMF and World Bank for cross-country living-standard rankings.
-
GDP per capita (nominal / current US$) — uses market exchange rates and can make commodity exporters look richer or poorer depending on currency swings.
-
GNI (gross national income) per capita — similar concept, sometimes used by World Bank for income classification.
-
Poverty headcount rates, Human Development Index (HDI), or multidimensional poverty — these measure deprivation directly rather than average income.
Because of these different measures and the frequent updates from IMF and World Bank databases, the exact ordering can change depending on the source and whether you use PPP or nominal dollars — but the same set of low-income countries typically appears near the bottom. For 2025, most reputable compilations using IMF/WEO and other databases place South Sudan at the bottom on a PPP basis.
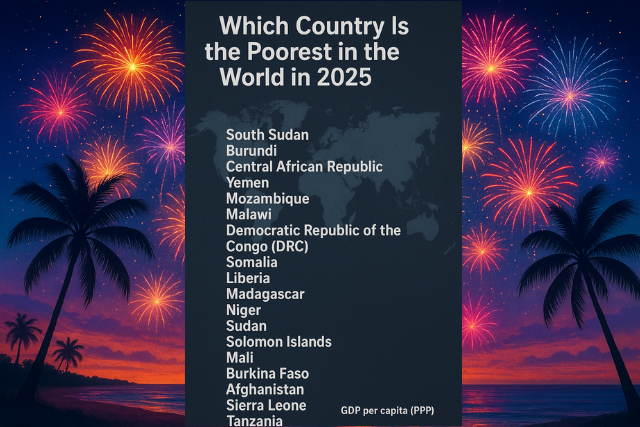
The poorest countries in the world in 2025 — top 20 (GDP per capita, PPP — typical 2025 rankings)
Below is a consolidated, plain-language list reflecting commonly reported 2025 rankings by GDP per capita (PPP). Exact dollar figures vary slightly between sources (IMF, World Bank, and independent data publishers), so this list focuses on the ranked order and provides representative context. Sources used for this consolidated list include IMF/World Bank-derived publications and data visualizations published in 2025.
1. South Sudan — poorest in 2025 (lowest GDP per capita, PPP).
2. Burundi
3. Central African Republic (CAR)
4. Yemen
5. Mozambique
6. Malawi
7. Democratic Republic of the Congo (DRC)
8. Somalia
9. Liberia
10. Madagascar
11. Niger
12. Sudan
13. Solomon Islands
14. Mali
15. Burkina Faso
16. Afghanistan (some datasets show Afghanistan among the lowest depending on coverage)
17. Sierra Leone
18. Tanzania (appears lower on PPP lists depending on year and data)
19. Guinea
20. Comoros / Gambia / Chad (these trade places depending on the dataset)
Note: different publishers may include or exclude territories and present slightly different orders — the list above aggregates commonly recurring low-income countries in 2025 across IMF/WEO-based summaries and independent visualizations.
Short profiles: why these countries are at the bottom
Below are concise reasons why many of the countries above rank among the poorest in 2025:
-
South Sudan: prolonged civil conflict since independence, collapsed public services, oil revenue volatility, displacement and food insecurity. Conflict has decimated productive capacity and public finances.
-
Burundi: deep economic crisis, limited access to electricity, high poverty rates, governance issues and weak external financing.
-
Central African Republic: chronic instability, weak institutions, poor infrastructure and repeated cycles of violence that suppress economic activity.
-
Yemen: civil war since 2015, huge humanitarian crisis, collapsed economy outside a few regions, and severe infrastructure destruction.
-
Mozambique, Malawi, Madagascar, Niger: structural constraints (dependence on agriculture and extractives), climate vulnerability, limited infrastructure, and relatively low human capital.
How to interpret the numbers (and why readers should care)
-
Rankings by GDP per capita (PPP) approximate the average purchasing power and are useful to compare typical living standards across countries.
-
Extreme poverty (people living on <$2.15/day or <$1.90/day) is a different and complementary measure; some countries with very low GDP per capita also have very high extreme-poverty rates, but policy and inequality matter.
-
A country’s placement on this list matters for international aid, concessional finance eligibility, and prioritization for development programs.
Limitations and caveats
-
Data quality and coverage: Some low-income countries have weak statistical systems; data are often estimates and revised frequently. The IMF and World Bank publish updates (WEO, World Development Indicators) that can revise 2025 numbers.
-
Short-term shocks: Conflict, commodity price swings, or climatic shocks can change rankings year-to-year. For example, a peace agreement or a major discovery could materially alter a country’s GDP trajectory.
-
Choice of metric: Using nominal GDP per capita versus PPP can reorder the list; always state the metric when comparing countries.
Where the numbers come from (sources you can check)
-
IMF — World Economic Outlook (WEO) database (April/October 2025 releases) — authoritative macroeconomic projections and PPP-adjusted GDP per capita estimates. If you need the official numeric table for 2025, the WEO database is the primary source.
-
World Bank — World Development Indicators / GDP per capita (current US$) — useful for nominal-dollar figures and World Bank country classifications.
-
Independent data visualizations and analyses (VisualCapitalist, Global Finance, FocusEconomics) — handy, readable ranked lists based on IMF/WEO or World Bank numbers for quick reference. These sources also produce shareable charts and summaries.
-
When publishing, state clearly which metric you used (PPP vs nominal) and date the data (e.g., “IMF WEO April 2025 estimates”).
-
Link to primary sources (IMF WEO database, World Bank WDI) so readers can verify numbers and download tables.
-
Consider adding an infographic or interactive chart (many readers respond well to a ranked bar chart or map showing GDP per capita using PPP) — sources like VisualCapitalist have examples you can emulate.
Frequently asked questions (FAQ)
Q: Is South Sudan the poorest country by every metric?
A: Not necessarily — South Sudan typically ranks last on PPP-based GDP per capita in 2025 compilations, but depending on nominal exchange rates, data vintage, or alternative metrics (GNI per capita, inequality, HDI components) other countries may appear at the bottom for certain measures.
Q: Will the same countries remain poorest in 2030?
A: Not guaranteed. Conflict resolution, governance reforms, foreign investment, natural-resource finds, or major policy shifts can change trajectories. Historically, sustained improvement requires investments in education, health, governance and infrastructure.